Defining a flight envelope for the Saturn V - Apollo |
 |
|
Figure 1 The Flight path angle and the Velocity are two of the most significant performance parameters to monitor the flight trajectory of a launch vehicle. |
|
NASA's internal note no. 68-FM-305: "An envelope of Saturn V malfunction trajectories which can achieve orbit" On this page is discussed an internal note (ref. 1, title mentioned above) prepared by the TRW Systems Group and the Flight Analysis Branch of NASA's Mission Planning And Analysis Division. The internal note was released in December 1968. This internal note concludes with a recommendation to include graphical information, containing the launch vehicle's abort envelope, in the plotboards used by the flight dynamic officer in the Mission Operations Control Room. The purpose of the abort envelope was to provide the flight dynamics officer with an early indication that a vehicle, which is slowly diverging from a nominal trajectory, will not reach a contingency orbit. The recommendation was intended to be used for the Apollo 8 mission, the first manned Apollo - Saturn V mission. The primary plot boards used by the flight dynamic officer were:
Flight envelope The construction of such an abort envelope would allow flight controllers and the flight crew to anticipate malfunctions which result in relatively slow diverging flight trajectories, which might be an early indication of an impending abort situation. Malfunctions which cause an immediate abort situation were monitored and detected by the Emergency Detection System (EDS), were of a different category and were not taken into consideration in determining the abort envelope. |
|
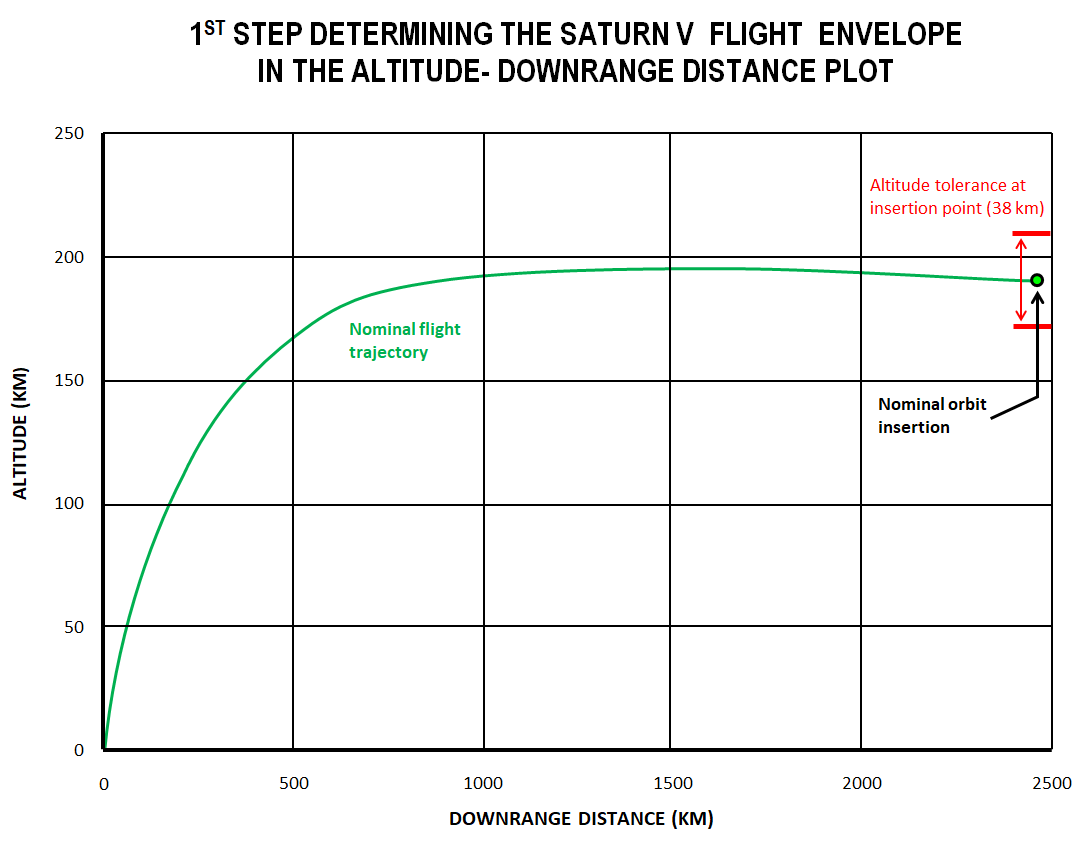
Step 1 in defining the abort envelope The first step in defining the abort envelope is determining the operational and physical constraints which must be considered when the malfunction trajectories are identified, which will shape the envelope. These constraints are actually defining the outer limits of the envelope. The constraints are depicted in figure 2. |
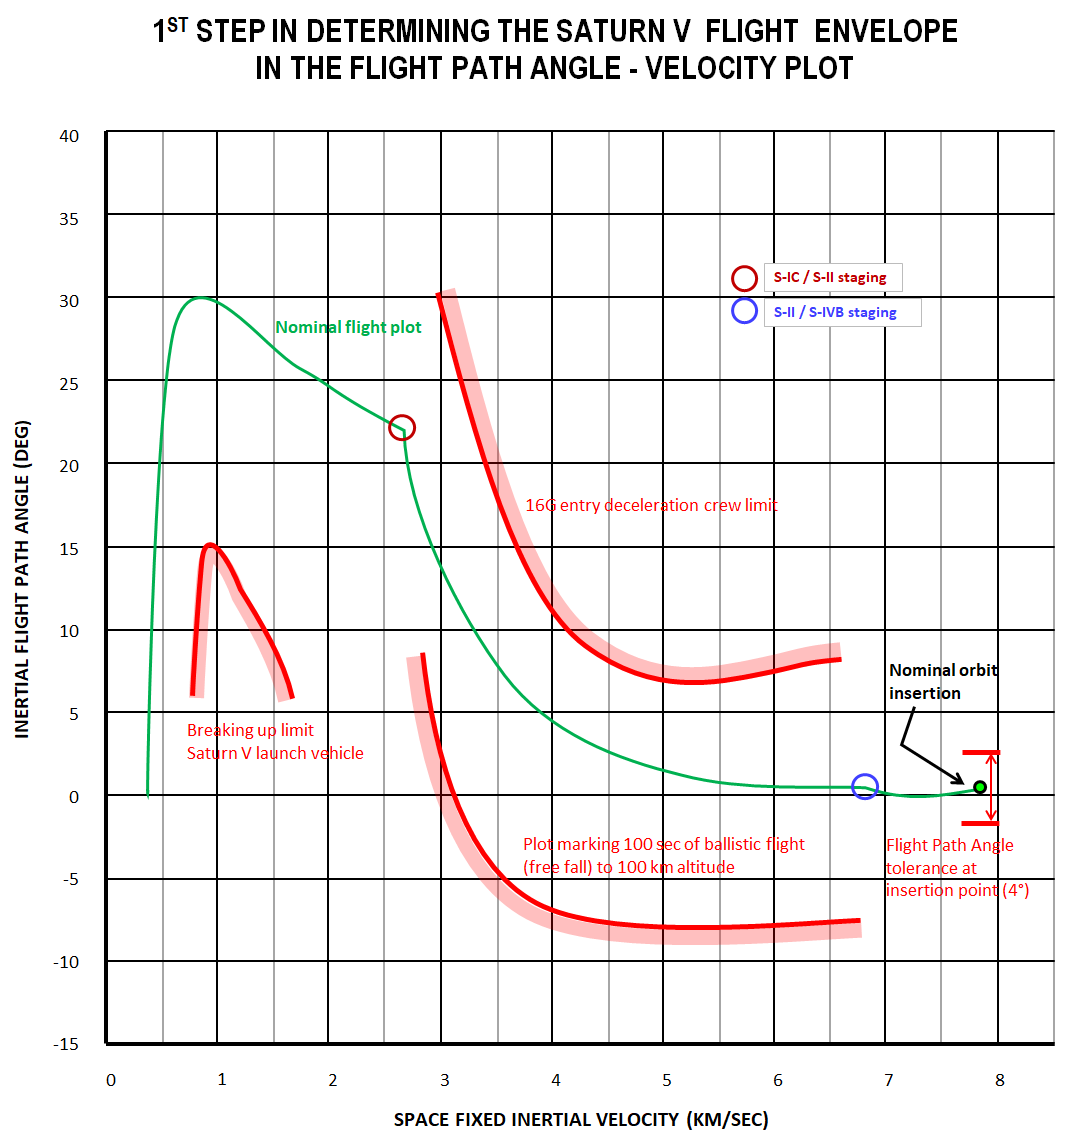
Figure derived from reference 1 figure 5. |
|
|
Figures 2a and 2b Step 1: Determining operational and physical constraints The set of flight trajectories which deviate from the nominal trajectory but will result in an orbit insertion are constrained by some physical limits and an orbit insertion requirement.
|
|
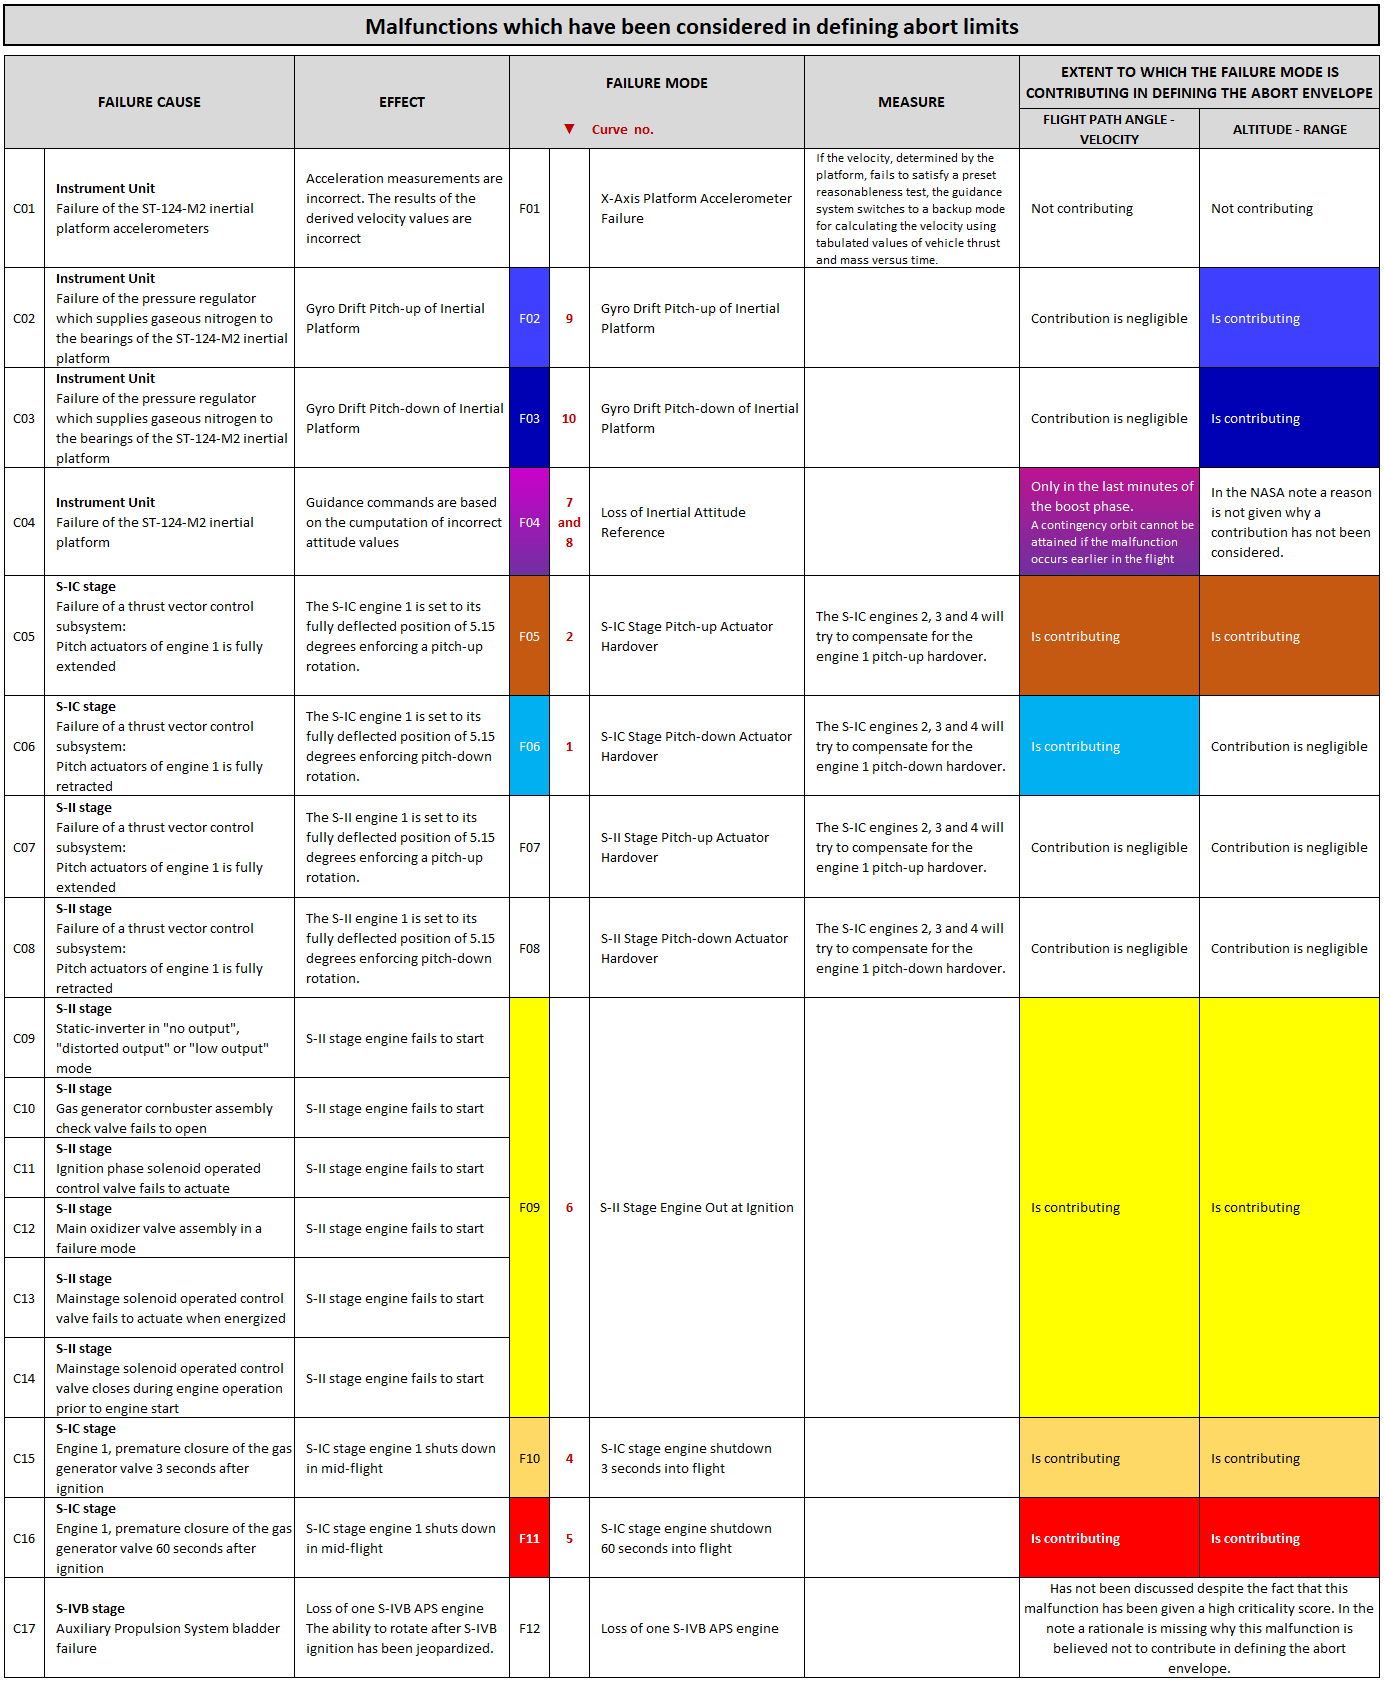
Step 2 in defining the abort envelope In figure 3 a table of malfunctions is listed which have been taken into consideration. But simulation studies have revealed that only a selection of these malfunctions are contributing to defining the abort envelope. The malfunctions which resulted in fatal failures are not mentioned in the list. These simulation studies were carried out in 1967 and 1968 by the TRW Systems Group by using the TRW Saturn Launch Simulating Program. The malfunctions which eventually were found to contribute to defining the abort envelope are:
|
|
|
|
Figure 3 Candidate malfunctions which can contribute to defining the abort limits
Simulation studies have shown that only a selection of the malfunctions listed above contribute to defining the abort limits. |
The failure modes 5 through 8 are related to actuator malfunctions. Figure 4 is helpful in picturing the impact of a hydraulic actuator failure. These actuators are used for thrust vector control by gimbaling the thrust engines.
The dark red numbers in the fifth column of the table shown above are referring to the curve numbers in figures 5 and 6. |
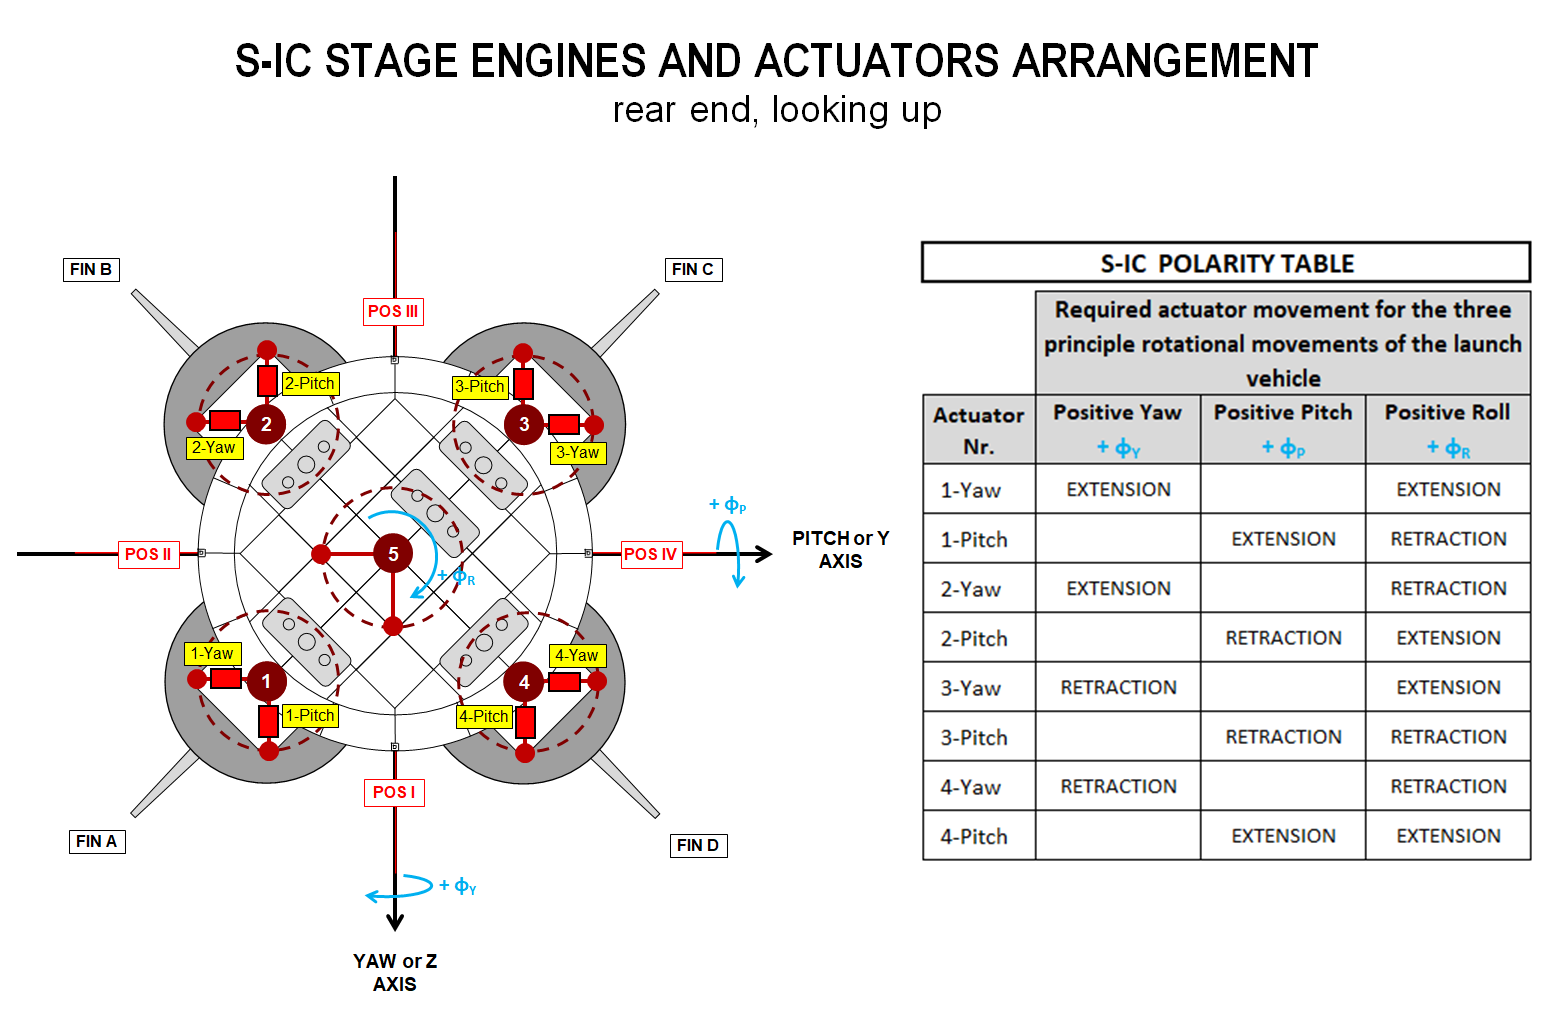
Figure based on reference 2 figure 7-15. |
|
Figure 4 Thrust vector control
The four outer engines of the S-IC stage were equipped with hydraulic actuators to control the thrust vector by which the flight trajectory could be controlled.
The actuators were orientated in such a way that each of them could induce a yaw movement or a pitch movement. The five engines of the S-II stage were arranged in a similar way. |
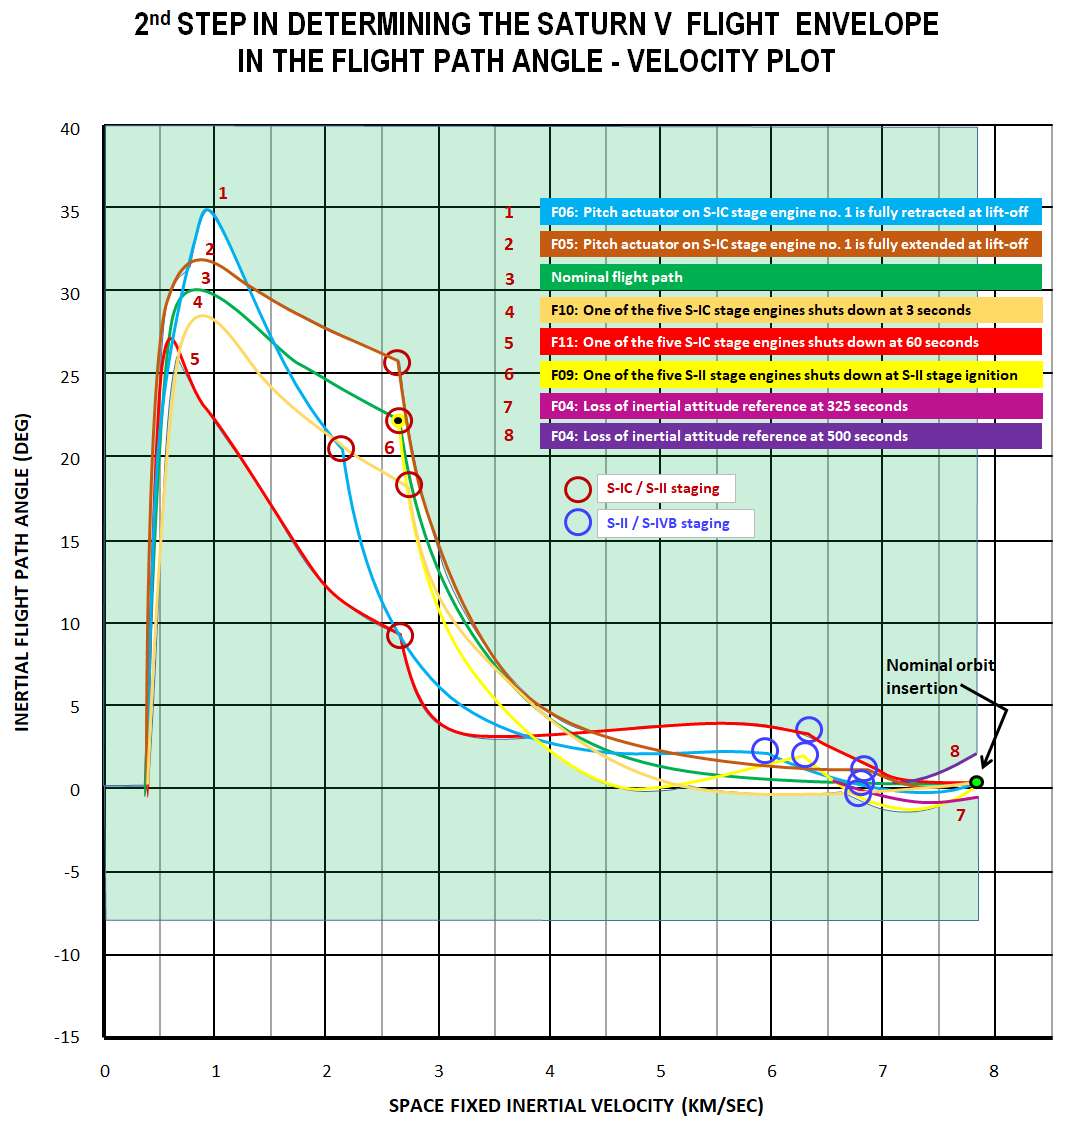
Figure based on reference 1 figure 3. |
|
Figure 5 Step 2a: Identifying malfunction trajectories which can achieve orbit insertion in an inertial flight path angle - velocity chart Only malfunction trajectories are shown here which contribute to defining the flight envelope.
Early engine shutdown
Note
Inertial platform failure
|
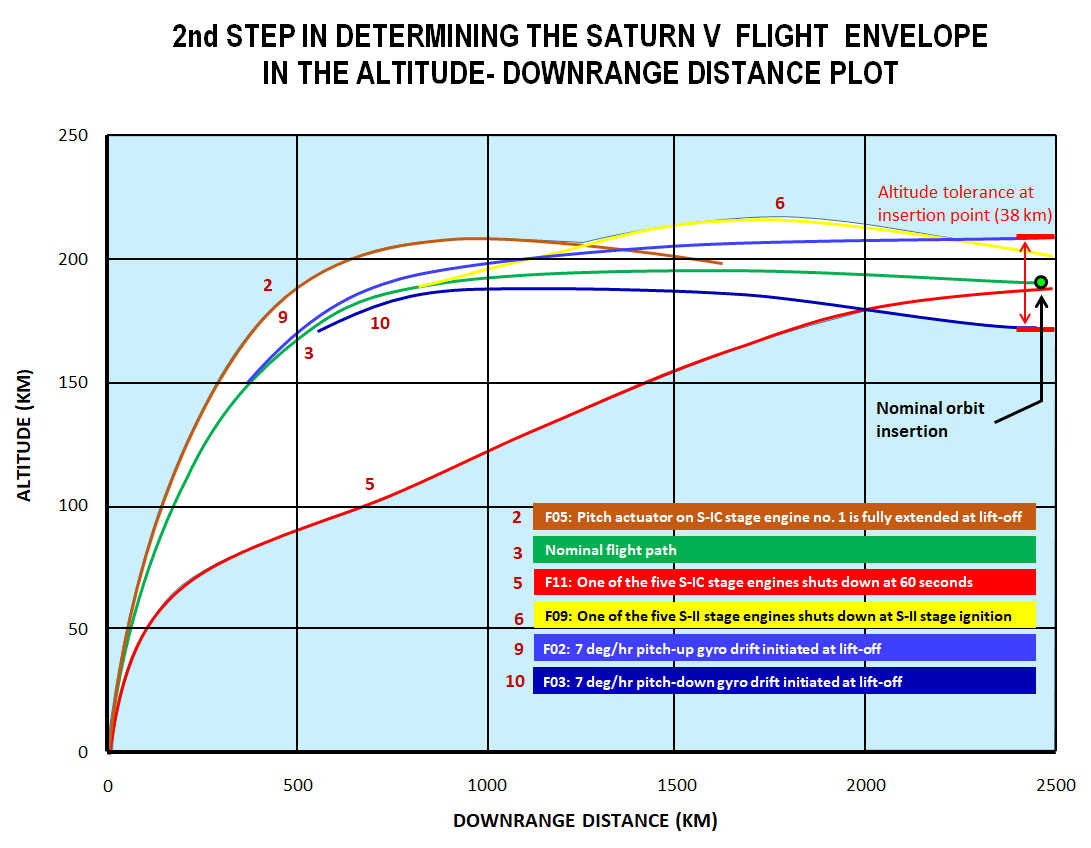
Figure based on reference 1 figure 4. |
|
Figure 6 Step 2b: Identifying malfunction trajectories which can achieve orbit insertion in an altitude - range chart As discussed in the caption of figure 5, a shutdown of an S-IC engine at 60 seconds (curve no.5) apparently results in an early reduction of the inertial flight path angle and therefore in a much lower ascent trajectory. This malfunction appeared to contribute significantly to defining the abort envelope. Note that curve 2 has been truncated as in reference 1, for reasons unknown. |
|
Conclusion of the NASA note (ref.1) In figures 7 and 8 are shown the abort or flight envelopes, which are the results of the TRW flight simulation studies. The NASA note ends with a recommendation to have these envelopes incorporated in the Flight Dynamics Officer's Inertial Flight Path Angle vs. Inertial Velocity and Altitude vs. Range plotboards to enhance the decision-making process when a launch vehicle is gradually deviating from its nominal trajectory and is approaching the edge of the envelope beyond which an orbit cannot be achieved. |
|
|
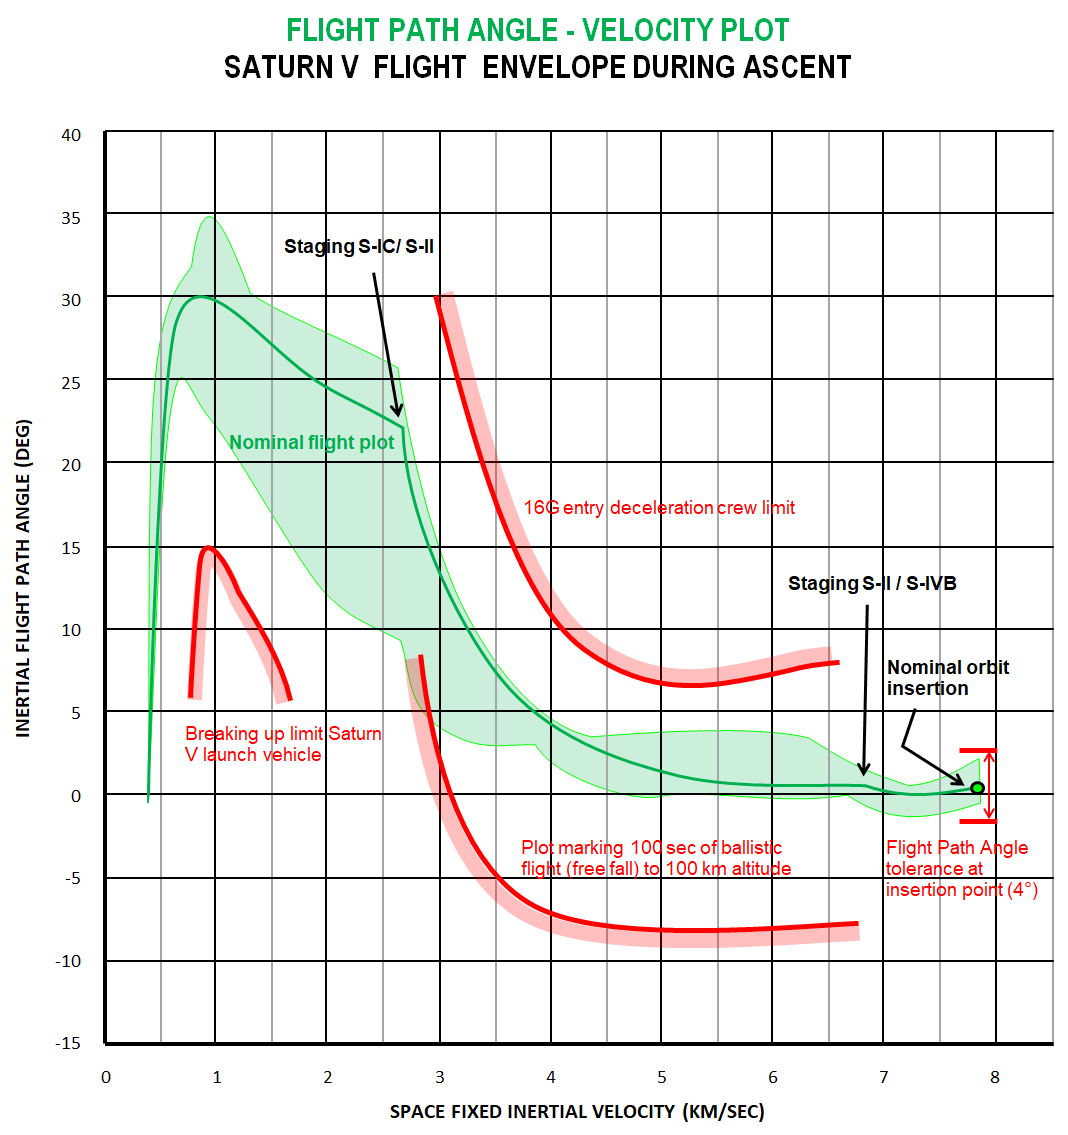
Figure 7 Flight path angle versus Velocity abort limit lines This abort or flight envelope is the result of figure 2a + 5: the operational constraints + the result of the TRW simulation studies in defining the abort limits. The lower abort limit is shaped by curve no.5 in figure 5 and is overlapping an outer limit. This curve violates the rule that the red-colored outer limits must not be exceeded. The risks involved were probably considered manageable. However, this violation might entail that if in that particular part of the trajectory a booster failure would prompt a (mode II) abort, there would have been less than 100 seconds left between the moment of spacecraft separation and the start of the reentry procedure. This would have jeopardized a controlled start of the reentry. |
|
|
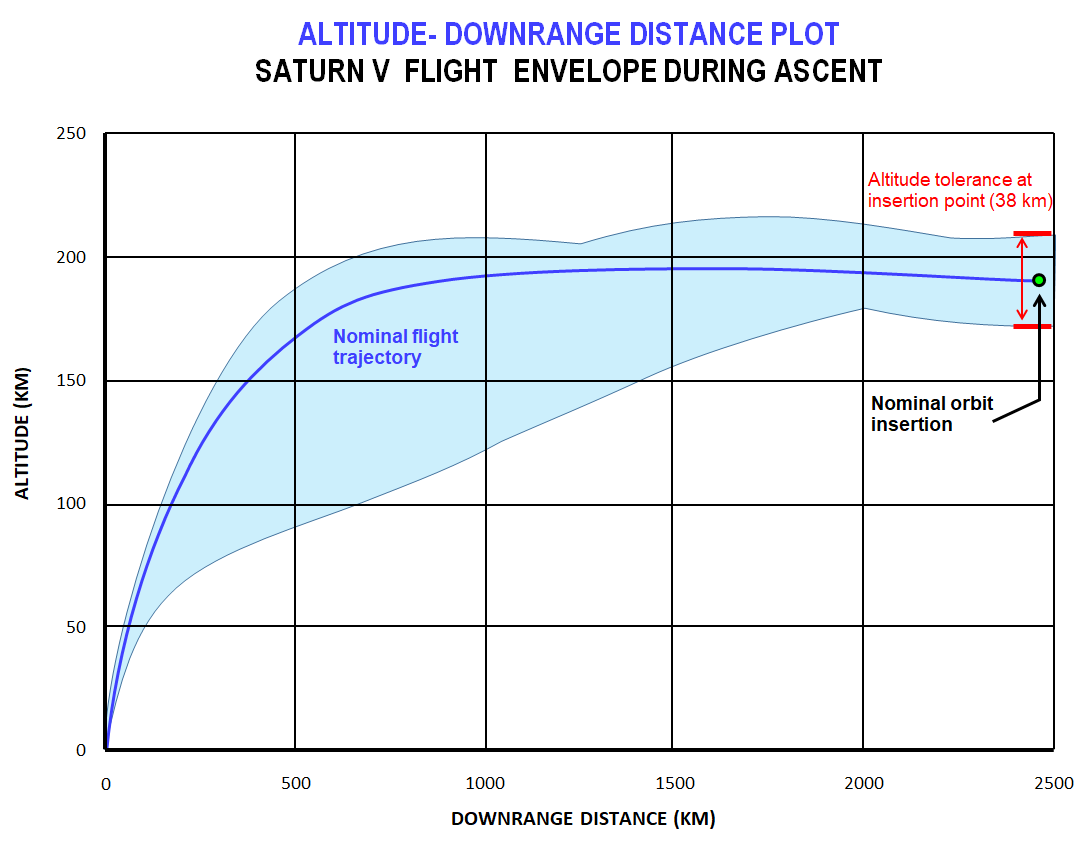
Figure 8 Altitude versus Range abort limit lines This abort or flight envelope is the result of figure 2b + 6: the operational constraints + the result of the TRW simulation studies in defining the abort limits. |
|
|
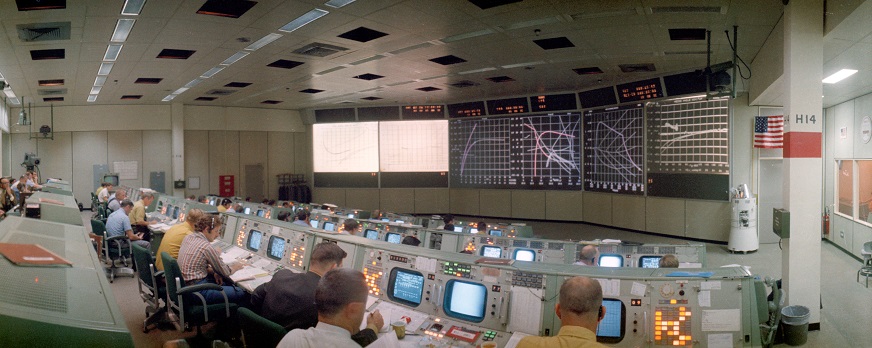
Figure 9 Plot screens in the Mission Operations Control Room to monitor the ascent trajectory of the Saturn V.
Wide-angle view of the Mission Operations Control Room just after lift-off of Apollo 15.
The 2nd and the 3rd plot screens from right to left are also intended to oversee the several abort mode regions in a flight path angle versus velocity plot. An abort will result in a landing into the Atlantic Ocean of the Command Module or a contingency orbit for the Command & Service Module. |
| Acronyms | |
|---|---|
| EDS Emergency Detection System | |
References
|
Site Map |
References |
Change History
|
Comments and questions are welcome. All pictures and drawings contained on and through these pages are the author's, unless otherwise noted. No unauthorized reproduction without permission. |